
OBJECTIVE:
The objective of this project was to simplistically and holistically assess UWA’s financial performance using its annual financial statements. This project was commissioned by the UWA Academic Staff Association.
KEY FINDINGS:
1) UWA’s ‘underlying’ performance measures have trended downward since 2014.
2) UWA has been borrowing cash or ‘cashing in’ investments to fund a cash deficit in its ‘day-to-day’ operations, particularly during 2018 and 2019.
3) UWA’s financial statements lack transparency. While the universities financial health can bewholistically assessed, an in-depth analysis of the performance of its core functions, as well as financial decisions, is difficult. This is because (a) while it is possible to determine how much UWA makes from teaching and research, it is impossible to determine how much it spends on teaching and research, and (b) UWA does not distinguish between restricted and unrestricted income.
4) The last year has seen considerable improvements in UWA’s ‘underlying’ performance measures as well as its cash position, however, this has primarily been a result of cost-cutting initiatives.
EVALUATING UWA’S FINANCIAL PERFORMANCE:
UWA’s perfomance can be evaluated by assessing the performance of its constituent parts
Given the diversity of UWA’s operations, one way to evaluate its overall performance is to assess the performance of its constituent parts. For example, since UWA’s core functions are teaching and research, it is useful to know how each of these functions are performing. Further, because UWA receives substantial income from ‘other’ functions – such as investments, donations, and bequests – it is also useful to know how these additional sources contribute to its overall performance. Hence, to meaningfully evaluate UWA’s operating performance, it is important to disaggregate and assess income and expenditure according to the functions in which they were derived from, namely:
- Teaching (e.g. income from student fees and teaching expenses);
- Research (e.g. income from research grants and research expenses); and
- Other (e.g. income from investments and donations and other miscellaneous expenses).
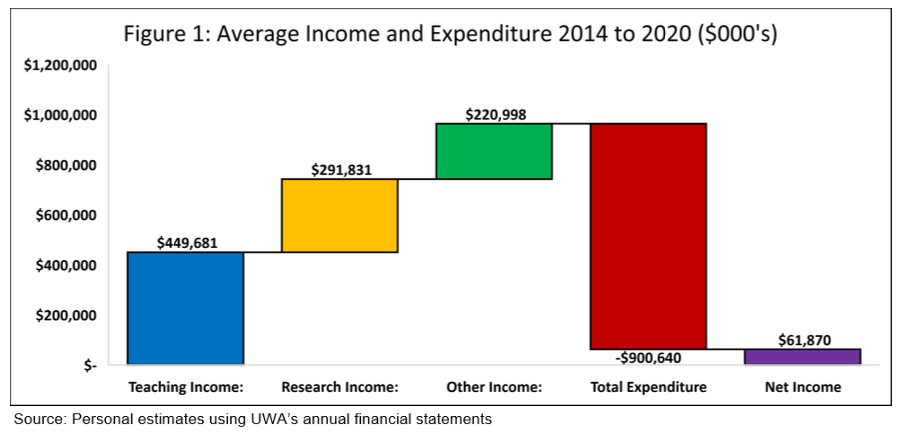
Although this idea is simple and effective in nature, it is difficult implement in practice. This is because, while UWA’s income sources can be disaggregated according to UWA’s core functions of teaching and research, there is insufficient public information to meaningfully disaggregate UWA’s expenses according to those same functions. In other words, while it is possible to determine how much UWA makes from teaching and research, it is impossible to determine how much it spends on teaching and research1 . This lack of transparency means that while UWA’s financial health can be holistically assessed, an in-depth analysis of the performance of its core functions, as well as financial decisions, is difficult. Hence, Figure 1 only displays the income UWA derived from teaching, research, and other activities against its total expenditure.
Examining Figure 1, on average, from 2014 to 2020, UWA received $449m (47%) of its income from teaching, $291m (30%) from research and $220m (23%) from other sources. Over the same period, total expeniture averaged $900m. Combined, this resulted in UWA reporting an average yearly net income of $61m (6%). At face value, an average 6% net income margin seems quite positive. This prompts the question, what is the problem and why is there a need for structural change?
1 While this result may seem surprising, this lack of transparency is consistent with the university sector as a whole. For example, in the words of Andrew Norton of the Grattan Institute, “Unlike England or the United States, Australia does not classify university spending according to its purpose” (https://grattan.edu.au/wp- content/uploads/2015/10/831-Cash-nexus-report.pdf).
Problem 1: UWA’s income growth has slowly been outpaced by growth in total expenditure
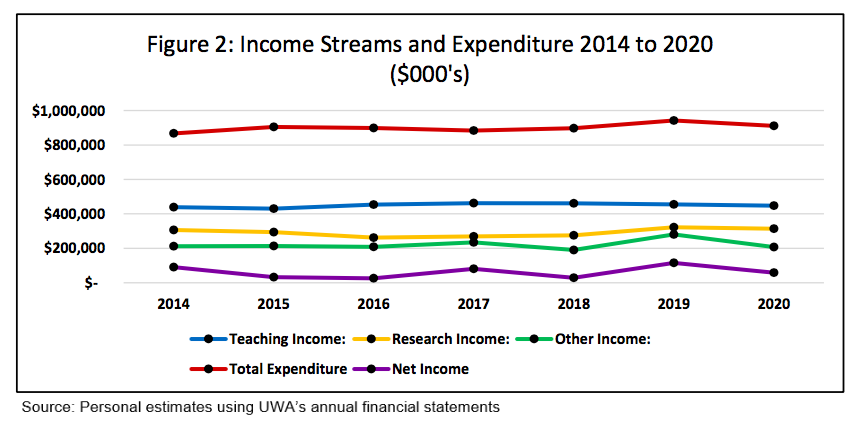
In diagnosing this problem, it is helpful to first examine the performance of these same measures over time (Figure 2). Examining Figure 2, from 2014 to 2020, teaching income increased $8m (+0.3% average annual growth rate), research income increased $7m (+0.4% average annual growth rate), other income decreased $5m (-0.4% average annual growth rate) and total expenditure increased $43 (+0.8% average annual growth rate) 2. One interpretation of these results is that over the last 7 years, income growth has been relatively stagnant – even before inflation – and is slowly being outpaced by growth in total expenditure. Although this is not an immediate problem – as net income is still positive – if nothing changes, the situation could continue to deteriorate over the longer term.
2 Growth rates are calculated as geometric means.
In addition to these longer-term trends, over the short-term, UWA’s net income appears highly correlated with other income. In fact, over the past four years, the biggest factor in determining the magnitude of UWA’s net income seems to be changes to other income. Because other income primarily consists of highly volatile investment income, and the ups and downs of the stock market are not something the university controls, it can be misleading to judge the performance of UWA’s underlying operations through solely looking at its net result. For example, when examining Figure 2, one might infer that UWA’s best year of operation was in 2019 as the net result was the highest. However, if we exclude UWA’s investment income from its net result, one might actually conclude that 2019 was UWA’s second worst year of operation (Figure 3). The reason for this discrepancy is that throughout 2019 the Australian Stock Exchange returned an impressive 20%, sending UWA’s total investment income soaring to $128 million and its net result to $120 million, more than double that of previous years. Further complicating the assessment of UWA’s operating performance is that investment income is not the only factor that can lead to a misleading result. There are many other misleading income and expense items that make the assessment of UWA’s ‘true’ operating performance difficult3.
3 If financial statement analysis were simple, we would not need an accounting and finance department!
Problem 2: UWA’s ‘underlying’ performance measures have deteriorated since 2014
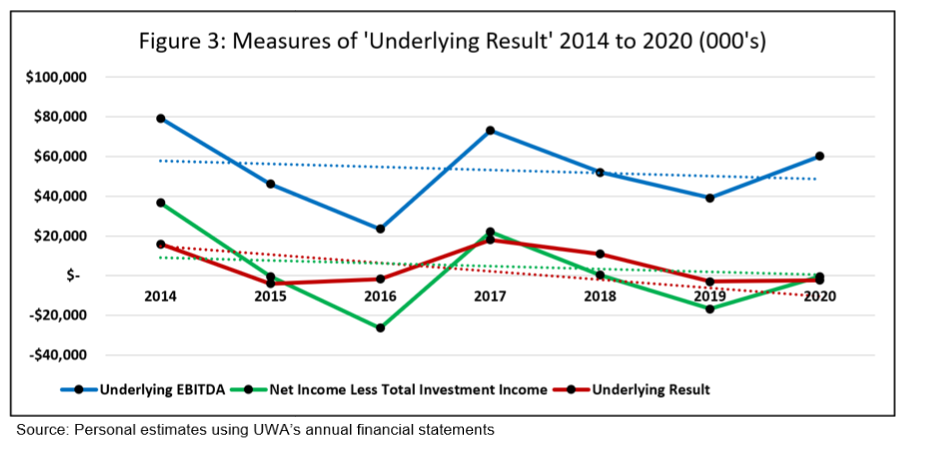
The notion that UWA’s net result may not reflect the ‘true’ performance of its operations is an important one as it motivates the calculation of an ‘underlying result’. An ‘underlying result’ is a financial performance measure that removes the effects of misleading income and expense items from UWA’s net result in order to gauge the ‘true’ performance of its ‘underlying’ operations. Although the idea is simple in nature, in practice it is difficult to implement as different stakeholders have different views as to how it should be calculated. Without getting too technical, the main measures are:
- UWA’s newly implemented ‘Underlying EBITDA’ measure4 ;
- The Australian Group of Eight universities ‘Underlying Result’ measure5; and
- A simple ‘Net Income Less Total Investment Income’ measure,
Although they all differ in their calculation, the one consistency across all three of these operating performance measures is that they have all trended downwards since 2014 (Figure 3). In other words, no matter how you slice it, it appears that the ‘underlying’ performance of UWA’s operations has been deteriorating for quite some time. This finding is an important one and likely serves as the motivation for structural reform within UWA.
4 ‘Underlying EBITDA’ removes the effect of total investment income, capital atructure and certain accounting policies.
5 ‘Underlying result’ adjusts UWA’s net result for items that are one-off or restricted in nature.
Problem 3: UWA’s ability to generate cash from ‘day-to-day’ operations has deteriorated
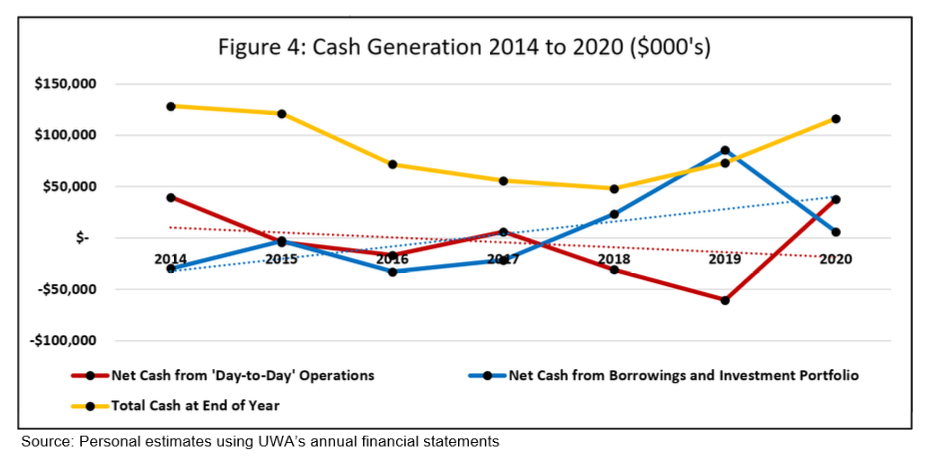
In addition to examining UWA’s income sources and ‘underlying’ performance measures, it is also important to examine its cash flows. This is because accounting rules usually require organisations to record revenues and expenses when transactions occur, not when cash is exchanged. Hence, regardless of UWA’s headline income figure, it is important to know how much actual cash UWA is generating in order to assess its ability to meets ‘day-to-day’ operational expenses. To do this, figure 4 plots UWA’s:
- Total cash balance at the end of each year6;
- Net cash generated from ‘day-to-day’ operations each year7; and
- Net cash generated from the repayments and proceeds from borrowings as well as the purchase and sale of financial assets each year (i.e. how much cash UWA generates from borrowing money and ‘cashing in’ investments)8.
Examining Figure 4, net cash generated from ‘day-to-day’ operations has trended downward whereas net cash generated from borrowings and investment portfolio has trended upward. Further, there appears to be a cash deficit in ‘day-to-day’ operations, particularly over 2018 and 2019. Combined, these results suggest that UWA is becoming increasingly reliant on borrowing cash or ‘cashing in’ investments to fund a cash deficit in its ‘day-to-day’ operations. This likely represents the “structural deficit” or “cash deficit” in UWA’s operating activities that is referenced by Amit Chakma9.
6 Refers to cash and cash equivalents at end of year.
7 Calculated as the net increase/(decrease) in cash and cash equivalents subtract the net of payments for financial assets and from the sale of financial assets and subtract the net of proceeds from borrowings and repayment of borrowings.
8 Calculated as the net of payments for financial assets and from the sale of financial assets plus the net of proceeds from borrowings and repayment of borrowings.
9This is a reference to one of Vice-Chancellor, Professor Chakma’s staff emails where he states that “the underlying structural deficit represents the cash deficit in our core general-purpose funds (excluding investment and restricted income) and the additional operational investment we should be making each year on infrastructure improvements. In previous years, the structural deficit has been partially offset by one-time cash funding, However, as a sustainable principle, one off funds should only be spent on one-time strategic initiatives and not relied upon to support core ongoing operations”.
CONCLUSION
This project simplistically assessed UWA’s financial performance using its annual financial statements. The key findings were that UWA’s ‘underlying’ performance measures have deteriorated and UWA has been borrowing cash or ‘cashing in’ investments to fund a deficit in its ‘day-to-day’ operations. Despite this, however, the last year has also seen considerable improvement in UWA’s ‘underlying’ performance measures (Figure 3) as well as its cash position (Figure 4), suggesting a reversal of previous trends may be at hand. This reversal was likely driven by the significant cost savings realised during the COVID-19 pandemic as well as the structural reforms implemented by the new Vice-Chancellor, Professor Chakma10.
10 To summarise, total teaching related income was relatively unaffected by the pandemic as lost student revenue from fee paying overseas students was offset by increases in government funding. Research income slightly decreased but remained above 2018 levels. Other income fell substantially, primarily due to a reduction in investment income. Total expenditure also fell substantially, primarily due to reduced expenditure on non- academic salaries as well as travel and other miscellaneous expenses. Combined, these changes resulted in little impact on UWA’s net income and an improvement in UWA’s ‘underlying’ performance measures. An improvement in UWA’s ‘day-to-day’ cash operations was also recognised as expenditure on PPE was substantially reduced.